subplot
MATLAB中的函數
subplot是MATLAB中的函數。
使用方法:subplot(m,n,p)或者subplot(m n p)。
subplot是將多個圖畫到一個平面上的工具。其中,m表示是圖排成m行,n表示圖排成n列,也就是整個figure中有n個圖是排成一行的,一共m行,如果m=2就是表示2行圖。p表示圖所在的位置,p=1表示從左到右從上到下的第一個位置。
在matlab的命令窗口中輸入doc subplot或者help subplot即可獲得該函數的幫助信息。
Matlab對subplot() 的解釋是:
SUBPLOT:Create axes intiled positions,意思是在均勻平鋪的位置上生成軸對象,這是一個在Figure對象層次上起作用的函數。
stem() 函數用來畫一張整圖,畫出來是離散函數。plot() 是連續函數,可以畫一張連續的圖;最一般最常用的畫法。subplot(m,n,p) 是畫一張圖中包含若干子圖,每個子圖也是連續的,可將多個圖畫到一個平面上。
示例1:
在MATLAB的命令窗口依次輸入以下命令:(>>不用輸入)
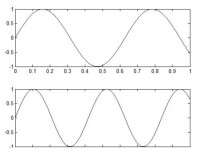
>> t=0:0.001:1;
>> y1=sin(10*t);
>> y2=sin(15*t);
>> subplot(211)
>> plot(t,y1)
>> subplot(212)
>> plot(t,y2)
subplot
function subplot_sample1()
close all
figure
grid on
t=0:0.001:1;
y1=sin(10*t);
y2=sin(15*t);
subplot(211)
plot(t,y1)
subplot(212)
plot(t,y2)
示例2:
function subplot_sample1()
close all
figure
grid on
t=0:0.001:1;
subplot(2,2,1)
plot(t,sin(10*t))
subplot(2,2,2)
plot(t,cos(10*t))
subplot(2,2,3)
plot(t,tan(10*t))
subplot(2,2,4)
plot(t,cot(10*t))

subplot
x1=[1 2 3];
x2=x1;
x3=x2;
x4=x1;
y1=[2 4 6];
y2=2*y1;
y3=3*y1;
y4=4*y1;
subplot(2,2,1)
plot(x1,y1);
axis([0,20,0,20])
subplot(2,2,2)
plot(x2,y2);
axis([0,20,0,20])
subplot(2,2,3)
plot(x3,y3)
axis([0,20,0,20])
subplot(2,2,4)
plot(x4,y4)
axis([0,20,0,20])

基本信息
- 中文名
- 分塊圖
- 外文名
- subplot
- 函數功能
- 是將多個圖畫到一個平面上的工具
- 簡單的例子
- 把繪圖窗口分成兩行兩列四塊區域
- 函數簡介
- subplot是MATLAB中的函數
- 應用軟體
- MATLAB
- 相似函數
- plot()